patrick.net
An Antidote to Corporate Media
1,207,859 comments by 14,353 users - askmeaboutthesaltporkcure, Ceffer, DeficitHawk, UkraineIsTotallyFucked online now

10 Year Yield Having A 2nd Taper Moment
2015 Jun 9, 7:31am 33,161 views 131 comments
by _ ➕follow (8) 💰tip ignore
« First « Previous Comments 45 - 84 of 131 Next » Last » Search these comments
The cycle has been blessed with low rates and the demand curve has been dreadful from main street.. but the Rich it has been solid

One of the points I have always tried to bring up going forward
Each housing cycle has had 2% 2.5% lower rates in the next cycle. For that to happen now you would need to see 10's base start at 0.95%
So you could have one more lower rate cycle left in the system, but the cow has been milked

One of the points I have always tried to bring up going forward
Each housing cycle has had 2% 2.5% lower rates in the next cycle. For that to happen now you would need to see 10's base start at 0.95%
So you could have one more lower rate cycle left in the system, but the cow has been milked
Except that housing prices have no correlation to interest rates.
Except that housing prices have no correlation to interest rates.
But the demand curve does have correlation to
PITI inflation (DTI) (LIT) factor models
It took me about 20 minutes to show wall street how this worked but they got it, it's just we have used outdated affordability indexes not adjusting to economic equilibrium
limf(x0 = sky
x-a
Can't exist


More and more economist and professors that I am talking to are starting to really understand what I am trying to explain, it's actually kind of fun talking to that group even though our worlds don't really collide much
“All truths are easy to understand once they are discovered; the point is to discover them.â€
― Galileo Galilei

I love the purity and direction of math & numbers.. but it's a boiling frog thesis when talking economics due to economic equilibrium which each cycle.
This group really wants to me discuss the economics of the housing inflation story in California, primarily the L.A. area where homeless has risen the last 2 years

But the demand curve does have correlation to
PITI inflation (DTI) (LIT) factor models
Not sure why you are trying to make this more complicated than it needs to be. Demand is strongly correlated with income. Period.
Demand is strongly correlated with income. Period.
I can't except that thesis for this factor model
If you just took out the extra % cash buyers in the last 4 years since rates were below 5%
The net demand is actually still at Great Recessions lows ....
Which is actually 21st century lows
Problem is the demand curve thesis
Since 2000
40 million more Americans are here
17 million more Americans are working
Rates were 8% then and 4% now
and even with the net 20% of extra cash buyers the demand curve is still at great recession lows from main street.
Even taken the housing bubble factor out of it ... the trend demand is awful

I can't except that thesis for this factor model
If you just took out the extra % cash buyers in the last 4 years since rates were below 5%
The net demand is actually still at Great Recessions lows ....
Which is actually 21st century lows
Problem is the demand curve thesis
Since 2000
40 million more Americans are here
17 million more Americans are working
Rates were 8% then and 4% nowand even with the net 20% of extra cash buyers the demand curve is still at great recession lows from main street.
Rates have gone down from 8 to 4% and demand is all time low according to you. Doesn't that tell you something? Maybe rates aren't that important??
Median income on the other hand has gone nowhere. Isn't that a better explanation?
When 2020-2024 comes around the demand curve will look a lot better
A lot more dual income college educated household having kids, so those years look much better because the
Wage inflation metric is much more stronger on that front that simple Avg wage growth

Maybe rates aren't that important??
I am a big rate person, but in terms of demand curve it stopped the expansion curve from growing in 2013
#causation
#correlation
#representation
Thesis in 2013 was than when rate rise it wouldn't matter... because rates don't matter..
excuse me.. puke.. sorry, that was a dreadful thesis because the demand curve was awful
PITI inflation factor is a weak cycle
what happened in the taper spike
This is the beauty as I am have shown the data on this over and over again which made people realize
Warning article on May 7th 2013
What happened after the rates spiked?

#FIRST time ever ... in American economic history
We had a reversal of demand trend in a up cycle in the later years of the cycle with rates under 4.5%
It created the bear market in purchase applications even though it was year 6 of the economic cycle
Something that no economist, housing pundit could ever imagine because in their mind they see rates at historic lows and the equate that to housing affordability
when the index it self is outdated anyway
MI2MP models shows but that's never the true story

The Pie capacity is smaller ... the dual income factor model is more important than ever...
There are 5 simple and obvious reasons why the financial media and housing pundits got it wrong in terms of demand for home purchasing and year over year growth in existing home sales in 2014.
Lending standards are not too strict
First, since none of these pundits have any financial lending experience they all naturally assumed that lending standards would ease making demand grow. It was painful to watch Steve Liesman on CNBC try to make a case to Diana Olick that if lending standards eased it would stimulate demand. Sadly, this is a misconception held many in the financial media and Wall Street firms. Mortgage standards are not overly rigorous in America. In fact, all you need to buy a home in America is a 620 fico score, 3.5% down payment and a debt to income ratio of not greater than 43%. Once this is recognized, the real problem, no wage growth and the lack of good paying jobs, will become the focus of how to grow the housing market.
Courtesy of Professor Anthony Sanders
mbap0430140
Housing internals are weak
Second, those housing pundits tend not to consider the “internals†of the housing market. The internals tell the story for those who care to look.
In a normal cycle we would see the following:
90% mortgage buyers
40% of that first time home buyers
10% cash buyers
In this cycle, however we see the following:
67-70% mortgage buyers
27-30% first time home buyer
30% plus cash buyers for the past several years
The internals show weakness in demand, not strength. What if the number of cash buyers returned to a normal 10% level of the market place? 2014 has a high percentage of cash buyers but the volume of sales are going down. With a lower percentage of cash buyers expected in the future, the number of mortgage buyers will need to increase just to maintain the current level of sales.
Too many low paying jobs
Also consider that this economic cycle has had a very weak income jobs recovery profile. In layman’s terms this means that the majority of the jobs recovered have been low wage jobs going to people 50 and over. The Debt-to-Income (DTI) and Liability-To-Income (LTI) metrics for home buyers are still high even though interest rates are low because wages are low and savings have been exhausted — hence the very soft demand for mortgages. The affordability index used by most of the financial media and Wall Street firms are terribly flawed because they assume everyone in America can make a 20% down payment. These days only the rich can come up with a 20% down-payment. In my business I am also seeing signs of economic stress in the would-be move up buyers. Many homes may no longer be underwater but the amount of equity is still generally small so there are fewer dollars available for the next purchase.
From Professor Sanders
http://confoundedinterest.wordpress.com/2014/04/29/juggernaut-case-shiller-20-home-price-index-rose-12-9-yoy-in-feb-too-bad-incomes-arent-rising-that-fast/
cs042914
Home prices are too damn high!
The term “housing recovery†suggests that home prices are now “returning to normalâ€. In truth however, prices are rising beyond economic reality of most Americans. While home owners and housing pundits alike were glad to see the return of home values to nearly pre-recession levels in some areas, nary a thought was given to how to how this would impact demand. Prices were up 15%-45% in 2 years — the biggest 2 year expansion we have seen outside the bubble years. While we are seeing some price reductions, there really isn’t any meaningful way to get a price correction in the market until inventories increase or there is another a job loss recession. One of the best things that could happen to the housing market would be a major cooling of prices from the crazy pace we have been seeing in the past 2 years. Nevertheless, I expect home prices will continue to show growth for 2014.
5. New home sales only account for 10% of the market
For years I have been saying that housing starts and sales will rise in the new home sale sector because the 80% correction it had in this cycle. And while this is true, new homes are only 1/10th of all home sales and tend to be for the more wealthy buyer. Housing inflation for new homes sales is well over the peak of the 2006 bubble in terms of median income to median prices. Growth in that sector is being carried by the wealthy. For the less wealthy home buyer, builders are competing with traditional (resale) homes which often provide a much better value. Therefore significant growth in the new home sector will be limited.
In short the housing bulls didn’t have the sophistication to know why things were soft; In a “real†housing recovery housing demand would grow by demand from main street America and mortgage buyers not from cash buyers. Even with mortgage rates below 5% since early 2011, zero interest rate policy by the Fed, and cash buyers being 30-35% of the homes bought, we are still going to finish 2014 as a negative year over year in home sales.
So to all the housing bulls who still believe there is growth coming in 2014, I ask you what kind of Housing Nirvana are you smoking. This doesn’t mean a housing collapse but also doesn’t mean growth in the housing sector for main street America. The only growth left this year are in new home sales and that is being held up by the wealthy buyers, not first time home buyers. Once main street America gets paid, then you will see a real recovery in housing.
ehsmar14
Now with this cycle in 2015... we need to see the how the market reacts because there is another factor working in play now
Household formation is rising, people are renting again, this is good, it's healthy
But... it needs just a little bit more time
1. Rent
2. Date
3. Mate
4. Marriage
3.5 -6 years after marriage = buy.. that is still looking good.
Dual income college educated Americans having kids... can still buy
We are just in phase 1 of that cycle.. why years 2020-2024 will look better.. best wage inflation for housing is 2 incomes ... beats 2.4% wage growth any century
and the best way to fight this

Why I strongly believe in not easing standards at all
http://loganmohtashami.com/2015/04/09/tight-lending-and-other-urban-legends/
My lord--you are definitely overly verbose.
Not sure why you chose to include the last 90% of your post. Your theory is that the small rise in interest rates had a large effect in 2013? Looking at your chart, I just see normal seasonality and a small decline from 2013 to 2014. Remembering that prices are still rising, however.
I've said this before, but I continue to remind you that sales are not always a good substitute for demand.
Remembering that prices are still rising, however.
I hear this back in 2003-2006
've said this before, but I continue to remind you that sales are not always a good substitute for demand.
I couldn't disagree with you more here
Adjusting to population the sales are dreadful but the demand curve for renting is booming
Math, Facts and Data matter, I can't live in a world or believe in something that the data doesn't justify it


In 2014 year 6 of the economic cycle
Even with higher rates, estimates by some were up to 5.7 million and 5.8 million existing home sales, everyone in America had growth
Which I totally understand curving the demand to adjust to population you should be around that level
However....
Only one person said demand curve will be negative year over year in 2014 if cash volumes falls because mortgage demand was weak after the taper spike...
What happened... first time ever in American economic history that existing home sales had a negative year over year print
#In an up cycle this late into the recovery
Even with inventory rising and in year 6 of the economic cycle sales came in at 4.9 million only 800K above the lows of the Great Recession even with 30% cash buyers (though total volume fell for cash buyers)
Number 1 Housing analyst in America Ivy Zelman April 2014
Nick Timiraos â€@NickTimiraos
Zelman existing home sales forecasts: 2014 at 4.8M (vs earlier 5.4M); 2015 at at 4.9M (vs 5.7M); 2016 at 5.0M (vs 5.9M). 2013 was 5.09M.
Nick Timiraos â€@NickTimiraos
Ivy Zelman slashes existing home sales forecast: now -5% for 2014, vs earlier +6% forecast. New home sales forecasts unchanged.(Big miss on her new home sales) estimates were 25% sales growth came in at 1.9% biggest miss on sales ever
More details here
http://loganmohtashami.com/2014/04/11/miss-housing-nirvana-crys-uncle/
For every 1% change in interest rate, purchasing power changes by 10% for the same monthly payment. Since most people qualify for mortgages at the top of their payment affordability (they buy "payments", not "houses"), if rates go up 1%, the house they can buy has to drop by 10% in price to keep the same payment.
If mortgage rates creep back up, it will put a big dent into this so called "housing recovery".
Just remember - as counterintuitive as it is, history says otherwise.
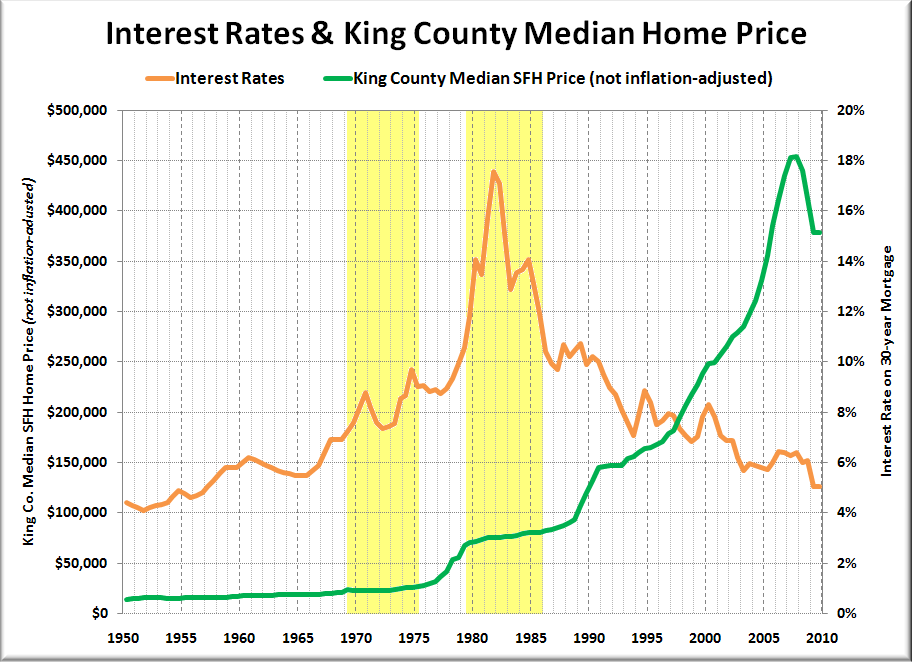
The 1980 homebuyer who balked at the 75K house was ass fucked when rates rose to near 18% and nominal prices never dropped in the slightest and in fact rose 25% over the course of the decade.
If anyone thinks this King Co chart is cherrypicking, heres the national chart which shows the same thing.
Math, Facts and Data matter, I can't live in a world or believe in something that the data doesn't justify it
That's the problem. The math, facts, and data don't always support your theories but you are unwilling to reconsider. You distort distort the data in an effort to make it seem to support your thesis rather than letting the data tell the story and finding a thesis that fits.
Like here:
I couldn't disagree with you more here
Adjusting to population the sales are dreadful but the demand curve for renting is booming
You've completely ignored my point that using sales as a substitute for demand may not be correct, but instead repeat that sales are low. Nobody is arguing that sales are strong. The discussion is your INTERPRETATION of that data---not with the data itself. Try to understand that.
You have the weakest demand curve ever from first time home buyers .... With the lowest rate curve on 10's since 1941-1945 ... But you do have the strongest demand curve for renting ... The battle between those who provide math facts and data compared to those with an economic assumption theory 
You have the weakest demand curve ever from first time home buyers .... With the lowest rate curve on 10's since 1941-1945 ... But you do have the strongest demand curve for renting ... The battle between those who provide math facts and data compared to those with an economic assumption theory
Do you really not understand the difference between arguing facts and arguing what those facts mean?
And you still believe that rates correlate with demand? Talk about ignoring facts....
My charts speak for themself ... You on another hand never provide
1. Data
2. Information
3. Charts
4. Historical context
To be honest I actually believe you're just talking for sake of having an debate....
It does?? Let's look at the last 25 years (that's as far back as FRED has house prices).
Yes it does. Here is that same Fred data set except it is going back 45 years
http://www.jparsons.net/housingbubble/
He also has the spreadsheet you can download if you want to look at the raw data.
*
See a general trend line of prices versus interest rates, except for the few years after the artificial bubble popped in 2006 and the system needed to reset to the norms?
Noted, that's why the 25 year data set gives us a assumption (i.e. higher rates = lower prices) that does not hold up when you look at the full 50+ year data set
The only way I can reconcile the full 60 year data set is to say that it generally shows nominal prices (a) stay flat or ooze upward in rising rate environments and (b) explode upward in falling rate environments. This would be consistent with the thesis of "sticky" prices and the relentless rise of nominal incomes (again nominal, not inflation adjusted) for the last 50+ years
The only real exception here was the 2006 bubble which we both agree was artificial.
The only real exception here was the 2006 bubble which we both agree was artificial.
Which doesn't get talked about enough inflation adjusted home prices for existing homes aren't back to the bubble in 2006
Only housing crop where inflation adjusted prices are higher than the bubble are for new homes

I hate this affordability index model
assumes every American has 20% down but a DTI of 25%...
However, it shows how 34 years of falling rates and rise of prices.... (Size) of the debt grows ... rate needs to be lower to service the debt and even in this
cycle with rates under 5% since 2011 the real demand curve from main street was to rent not to buy
Very strong demand from Rich though

The issue I have with that data is that he uses "inflation adjusted" data for his graphs.
No he doesn't. The red line is inflation adjusted, but the blue line is nominal. This is what is shown in the 60 year chart too.
Call it Crazy says
I think the last 25 years is a large enough time frame to get a trend.
The last 25 years gives you a picture that blows up in your face if you look at the last 60. Also, the last 25 years does not have a single incidence of a sustained increase of interest rates. Thus why would you use it to come up with a thesis of what happens with a sustained increase of interest rates (rising rates = falling prices), when the only (albeit older) data shows the exact opposite of the rising rates = falling prices concept?
Plus, a big dynamic changed in the 80's with dual income households becoming more popular (which I believe added to the faster rise in prices from the late 80's along with dropping rates). Back in the 60's and 70's the majority were single income households (which is why prices grew slowly with rising rates).
Noted. And since this period coincided with very high inflation, its pretty astounding that nominal home prices rose so little. Yet as we know (but don't like to admit) is that rising nominal incomes is a lagging, yet necessary component of inflation (this also shows up in those charts BTW). Thus, the 1980 waiter who passed when the house cost 75K found the house "cheaper" in 1982 when it cost 3% more, and his (or his and her) income rose 8% (or whatever). Granted, he was still getting slaughtered at the grocery store where things were rising more than the 8% income rise, but again, that's what the data shows us.
If the last 25 years can't give you a good indication of the CURRENT housing market, then you're grasping for straws...
The last 25 years gives us a very good indication of what happens in a falling rate environment, but tells us nothing whatsoever happens in a sustained rising rate environment because it has not existed in the last 25 years. Thus, what people on Patnet have consistently done for the last decade is to automatically assume the reverse (i.e. if falling rates = rising prices, then rising rates MUST = falling prices). This argument has intuitive appeal as people DO shop for payment as you said. Still, the data (yes old but the only data on point) tells us the rising rates = falling prices does not happen. Instead, the payment shoppers get sidelined until such time as their nominal incomes rise (hopefully faster than the rise of prices) that they can afford it. This is the only thing that I see that can reconcile the entire 60 year data set.


I get your whole point about 50 - 60 years ago, but what happened back then has very little to do with today's housing market
Yes, but it has everything to do with how people respond to stimuli, and in that regard, human behavior doesn't change over time. In a vacuum, higher rates could and should equal lower prices, but this isn't the case, which is the whole reason I have been vexed by this question and the only way I can reconcile all the data with human behavior. That said, I should note if (a) lenders added a rate premium which had nothing to do with bond rates or inflation or (b) nominal incomes stopped rising, then I would bet you dollars to doughnuts the rising rates = falling prices would ring true. Yet, as long as the US remains the words dominant hegemonic power there is no chance of this happening.Call it Crazy says
Which is why I used the last 25 years a snap shot.
That may be so, but it is also the one that has been bandied about bubble blogs for the better part of a decade - sometimes purposefully as people have intentionally deleted the 1970-1990 data to "prove" what they want to believe that if they wait, prices would fall:
/misc/Median+House+Price+vs.+Nominal+Interest+Rates+%281980-2011%29
You and I are old dogs here and remember and lived the double digit mortgage rates. The majority of the kids here only know about them from history books!
Actually, I was in pre school back then. Thus it baffled me when the few gristled vets I talked to (pre graphs) noted they didn't remember home prices falling in the early 80s since I had no memory of the period and the rising rates = falling prices thesis intuitively made sense. Either way, I am much more interested in accuracy as misinformation on housing has caused real pain to my family, and I wanted to feel very comfortable about the whole interest rate vs. price issue before I would weigh in on the topic. In real life, I like to fuck around as much as the next guy, but its only on this topic where I become the pedantic dickhead I am here.
My charts speak for themself ... You on another hand never provide
1. Data
2. Information
3. Charts
4. Historical contextTo be honest I actually believe you're just talking for sake of having an debate....
You provide so many charts that there's no need for me to provide any more. My disagreement isn't with your data or your charts, it's with your interpretation of that data, like I said. You use sales as a representation of demand. As I told you before, that assumes unlimited supply, which is clearly not the case. You continue to post that demand is inversely correlation with interest rates despite the historical evidence showing this to be untrue. I wouldn't even say I'm arguing--just trying to point out some flaws in your reasoning.
As I told you before, that assumes unlimited supply, which is clearly not the case

2014 Inventory up
--- Rates Up----
Demand negative Year over Year
YoY ... purchase application demand

Higher PITI inflation rates cause the first negative demand curve in an up cycle
Like I said
You never provide any data, charts, or information
You have an economic assumption theory that the data doesn't agree with but in your own mind you believe your right
To that I can't change your thinking nor will I try because men like you never bring
Math, Data, Facts into the equation
Your economic assumption theory's do have
limf(X) =sky
x-a
It's ok...
Last 20 years I have seen people shun away from math, facts, and data and live off of spin .... your sentence structure speech patterns, no different.
That's completely fine everyone has to have their own thing
Mine, simply is
Math, Facts and Data matter, numbers don't lie... people do, however.
2014 Inventory up
Up isn't the same as unlimited. It's up from low levels and still BELOW what most people believe is equilibrium. That's why prices are rising.
Like I said
You never provide any data, charts, or information
You have an economic assumption theory that the data doesn't agree with but in your own mind you believe your right
To that I can't change your thinking nor will I try because men like you never bring
Math, Data, Facts into the equation
Your economic assumption theory's do have
limf(X) =sky
x-aIt's ok...
Last 20 years I have seen people shun away from math, facts, and data and live off of spin .... your sentence structure speech patterns, no different.
That's completely fine everyone has to have their own thing
Mine, simply is
Math, Facts and Data matter, numbers don't lie... people do, however.
I do provide charts and evidence, when I believe that someone is wrong about data or facts. In this case, you are interpreting the data incorrectly. There's no need for me to post the same data again in order to show you how you are misinterpreting it.
Please tell me specifically which economic assumption of mine is not supported with the data. I'm all ears.
You love to pretend that you're the only one that like data and facts. I can assure you that I am at least as interested in data and facts as you. I just choose to let the data speak before I draw any conclusions. You don't. So, again--please tell me which economic assumption of mine is not supported with the data. I've already told you 2 of you assumptions that are incorrect and not supported with data.
There's no need for me to post the same data again in order to show you how you are misinterpreting it.
I have never seen you post any data ever
Please tell me specifically which economic assumption of mine is not supported with the data. I'm all ears.
That rates don't matter...
I have never seen you post any data ever
You obviously haven't read many of my posts
That rates don't matter...
Now that's funny. On this very thread, another poster has shown you the data. I posted something similar a long time ago. I'll try to find the old post and copy it here too.
I've already told you 2 of you assumptions that are incorrect and not supported with data.
This kind of statement is exactly what I am talking about ... seriously.. there are plenty of housing bear trolls that you will have a better discussion with than me.
All I show is data.. if America was watching our conversations what do you think they would say
The man hiding behind a fake name who presents no data is trying to talk his way with an economic assumption theory
The man who doesn't hide behind a fake name, writes about housing, speaks to economist and gets invited to economic conferences actually presents a very simple
#causation
#correlation
#Representation
factor model
Come one, you really think this game your playing works on people
You had one aggressive move in rates in this cycle and that changed the PITI factor so much that everyone whiffed on their 2014 sales call
The cycle wasn't ready for higher rates and that created the first ever bear market on purchase applications in an up cycle ( year 6) ever recorded since the data was collected
In fact the reason they gave for the excuse for the decline curve shift in demand
"A sharp move in interest rates"
This is from the number #1 Housing analyst in America too
"I think nirvana took a pause," Zelman told CNBC on Wednesday. "During that time home prices were surging and we had very attractive affordability, and a few months after I was on we saw rates surge about 100 plus basis points and we saw a pause.
The consumer was rationally responding to the surge in prices and the backup in rates."

All I show is data.. if America was watching our conversations what do you think they would say
The man hiding behind a fake name who presents no data is trying to talk his way with an economic assumption theory
The man who doesn't hide behind a fake name, writes about housing, speaks to economist and gets invited to economic conferences actually presents a very simple
I'm commenting on the data you already posted. Do you really need me to repost it? Why?
You had one aggressive move in rates in this cycle and that changed the PITI factor so much that everyone whiffed on their 2014 sales call
I thought everyone has whiffed on their sales calls for 3 years running? And it was because prices are too high-isn't that your thesis?
Regardless, if your argument is that spikes in interest rates can have short term effects on demand--I will grant you that is possible. But, looking at historical data over long periods, there is no correlation between rates and demand. Hell, even after the spike you posted above, rates were still very low.
I'm commenting on the data you already posted. Do you really need me to repost it? Why?
This is your tactic,
.....
This is just a guess
You're a female, from Hawaii or the islands and I am going to say you're a baseball fan because you like stats?
How did I do?
See, I come with data first ... and then show the relationship factor
You just come out of no where
Seriously, as a friend, I am telling you, you say things that make no sense what so ever.
It's ok, because you're not an economist, you're not a housing analyst, you don't write about housing and you hide behind a fake name which means it's ok because you don't need to be right
This is all fine, nothing wrong with what you're doing
However, you say things that just aren't realistic
Hint: Narcissism is your enemy not your friend
I myself am only bounded by math, facts and data if I said the things you have said on Patrick I would be laughed at. It's not your fault, this isn't what you do for a living.
However, don't think for a second this mickey mouse stuff works on someone who lives off numbers. :-)


What was the demand curve during the lowest interest rate cycle ever in 10's
Here

Math
Facts
Data
Matter.... you have to know why something happens... that's the only way you get to the truth
Seriously, as a friend, I am telling you, you say things that make no sense what so ever.
However, you say things that just aren't realistic
Instead of continuing to repeat this nonsense, why don't you just have a discussion about the data and interpretations? You always want to distract trying to make it personal, either about me or you. Let's just discuss the data.
So, again, what am I saying that is not realistic? What am I saying that makes no sense.
In case you forgot, here's what I'm saying. If you look at historical data, there is no correlation between interest rates and nominal house prices. This is because incomes are the main driver in house prices, and income is strongly correlated (negatively) with interest rates. That relationship overrides the expected dependency between prices and interest rates. So, what doesn't make sense there?
Instead of continuing to repeat this nonsense, why don't you just have a discussion about the data and interpretations? You always want to distract trying to make it personal, either about me or you. Let's just discuss the data.
Your tactic... it doesn't work with me
If you look at historical data, there is no correlation between interest rates and nominal house prices
Another tactic, change subject, I am talking about demand curve "COME ON" seriously, I have home prices going up for years now...
This tactic you do doesn't work on me...
Miss ... I presume...
My lady, you're dealing with someone who looks at every single data possible every day of his life.. Not just housing but every economic indicator here and over seas
When I post demand curve numbers that means demand curve not prices... Really....come on my lady you know better....
Since inventory levels broke under 6 months that gives pricing power in almost every cycle unless the inventory level shifts above 6 months or you get front loaded with distress sales
We have inventory under 6 months
We have traditional sales rising and distress sales falling
With unemployment claims hovering at a 15 year low there is no recession sign what so ever

My lady I am trying to make the point that I am not the person you should be trying these tactics with... There are plenty of people here that would love to go back and forth on non mathematical statistical trends
Your tactic... it doesn't work with me
lol--you're kidding, right? You do it again on the last post!
Miss ... I presume...
Another tactic, change subject, I am talking about demand curve "COME ON" seriously, I have home prices going up for years now...
OK, let me remind you what we were talking about:
Logan Mohtashami says
Please tell me specifically which economic assumption of mine is not supported with the data. I'm all ears.
That rates don't matter...
Do you remember now?
« First « Previous Comments 45 - 84 of 131 Next » Last » Search these comments
http://loganmohtashami.com/2015/06/09/10-year-yield-having-a-2nd-taper-moment/
#housing