patrick.net
An Antidote to Corporate Media
1,196,600 comments by 14,079 users - Ceffer, GNL, iommian, richwicks, Tenpoundbass online now

« First « Previous Comments 119 - 158 of 177 Next » Last » Search these comments
Apparently you don't know the calculations. Incomes have increased with inflation over 30 years (one generation) almost to the dollar. Home prices have MORE than increased with inflation. In fact, they have increased right in step with inflation PLUS interest rate drops such that monthly payments are the same today as they were 30 years ago adjusted for inflation.
Please show me your calculations.
If you plot house prices vs. interest rate--there is NO correlation. If you plot house prices vs. income growth there is a strong correlation.
Yes, you've proven that over and over again here....
I expected this comment a little quicker. You're slipping.
Oh, you mean those two blue marks that are in negative territory for Nov. and Dec. on the C/S graph??
The non-seasonally adjusted ones? lol. That's the best you've got??
Hey Tat, I think the true data disproves your comment:
I haven't seen that second graph before, does Case-Shiller put out a longer term on that...or do you know of a database? As long as finance rules, it is the key graph.
I looked at a complete teardown shitshack in Parkside and it was listed at over 750K. If that's not a strong indication of a top forming.. ;)
The sucker is the one who is left holding the empty bag at the end.
Yeah, Non-Seasonal (you know, the REAL numbers) not the massaged "seasonally adjusted" numbers....
No--you're right. It's prefectly appropriate to compare December to July. There are just as many people moving in both months, wouldn't you agree?
Please show me your calculations.
Here they are...
So I posted earlier my analysis of Fullerton 1980s vs. today, right? I did the same on Morgan Hill. It was tougher because it's a newer area...but I found several homes with purchase histories in the 1980s.
Overall, it's the same story. Monthly payments for a home purchased today are comparable to monthly payments in 1980s. For example, a 1700 sqft home purchased in 1988 for $210k with 10% down carried a monthly payment of $2066 (a pretty standard size/sale price for the area it seems). This required an income of $88k, while the national median income at the time was $26k. Only an upper middle class family (or better) could afford this.
Flash forward to today, and that monthly payment with inflation is $4068. If someone put down 10% and pays 4.4% interest with that $4068 payment, they are purchasing a home that cost $660k. This payment requires an income of $174k, while the national median is ~$50k. Again, the family that purchases that home today has to be well off...just as their parents had to be 26 years ago!! Homes have simply increased in "value" because of inflated wages and lower interest rates.
A couple of caveats. First, I was shocked when I ran these numbers in Fullerton and discovered it wasn't as unaffordable as I thought! Yet I think housing is overpriced. haha. Second, my numbers don't work with existing list prices. They are about 20% over what they should be based on monthly payments. That is because cash has been king for about a year now and propped up the market 20% over where it should be. So that home in Morgan Hill would actually list for, say, $750-800k.
So homes are in line with historical (at least one generation historical) plus a little blip from all cash buyers in 2013. BUT here are the two biggest problems: First, a 10 or 20% downpayment costs a lot more today because home values have increased beyond just inflation. (Notice that 3.5 and 5% downpayments have been en vogue although harder to get in 2014...) Second, today's buyer cannot refinance in 10 years because interest rates will not be multiple percentage points lower.
Now, in Palo Alto, for example, this is not the case...homes disconnected with monthly payment values with the tech booms because people are making large downpayments (or all cash) and demand is high. Mortgages don't matter.
That chart came from Marketwatch this morning...
Didn't notice it below the Bitcoin mess headlines
Apparently you don't know the calculations. Incomes have increased with inflation over 30 years (one generation) almost to the dollar. Home prices have MORE than increased with inflation. In fact, they have increased right in step with inflation PLUS interest rate drops such that monthly payments are the same today as they were 30 years ago adjusted for inflation.
Please show me your calculations.
If you plot house prices vs. interest rate--there is NO correlation. If you plot house prices vs. income growth there is a strong correlation.
FWIW:
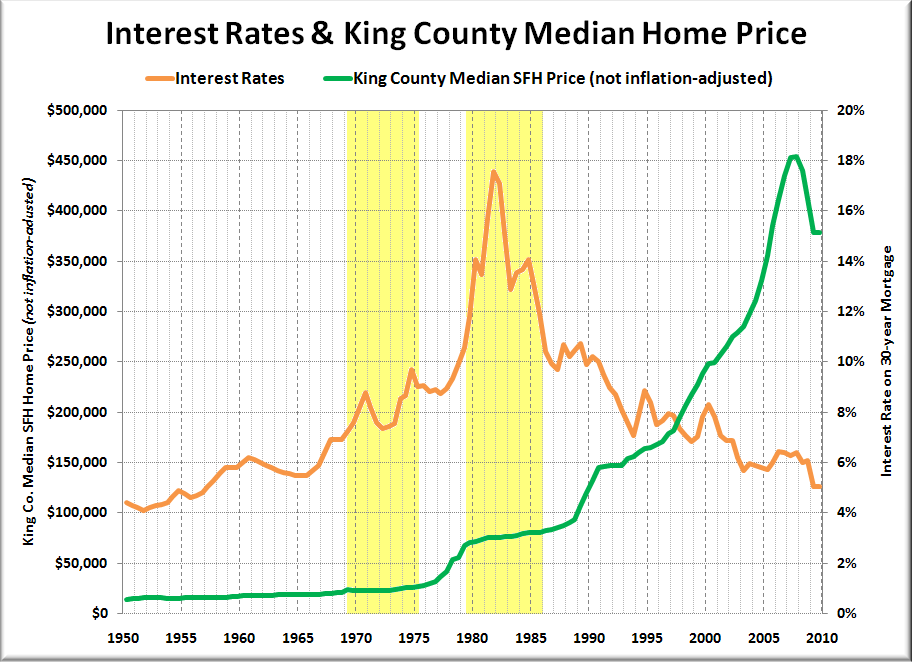
Now in real (inflation adjusted terms) there is a correlation. But, in nominal terms, lets just say the guy who didn't buy in 1980 @75K was pretty pissed when interest rates tripled and the nominal price continued to ooze slowly upward...
Here they are...
OK--it's a nice analysis, but very specific to one certain area. I wouldn't be comfortable extrapolating it to apply in general.
I disagree with your earlier assumptions as well.
Incomes have increased with inflation over 30 years (one generation) almost to the dollar
Incomes have increased more than inflation. Medians might not show it because of increased disparity.
OK--it's a nice analysis, but very specific to one certain area.
Thanks, I've also tried it in the LA area and San Jose (ie, BA outside of Steve Jobs' direct sphere of influence). I was mainly looking at the difference between me buying today vs. my parents buying 30 years ago. Trying to figure out how to complain to them that life isn't fair.
Unfortunately, I was wrong.
Incomes have increased more than inflation. Medians might not show it because of increased disparity.
I think we would need to look at historical quintiles to confirm this. Because...

I think we would need to look at historical quintiles to confirm this. Because...
OK here you go:

But, even in your chart above, there have definitely been gains in real median income over the last 30 years. Looks like ~10%?
OK here you go:
Nice chart...changes in tax code are the difference between yours and mine! I am going to plug those numbers into my calculations (later at home) and see how things line up if people were to spend the some proportion of their income on housing.
Probably the middle and fourth fifths (maybe 81-90) are primary mortgage borrowers...?
But, even in your chart above, there have definitely been gains in real median income over the last 30 years. Looks like ~10%?
yeah, I figured that was a wash now that we all have cell phone bills and internet service...
Probably the middle and fourth fifths (maybe 81-90) are primary mortgage borrowers...?
Probably--but not in the areas you analyzed. In the areas you looked at, I'd say it was all in the top 10%. Maybe some 81-90.
yeah, I figured that was a wash now that we all have cell phone bills and internet service...
Don't go changing things now. Some costs have gone away (long distance calling bills), some have increased. Let's try to stick to facts.
A few quotes from the article:
The US mortgage before the 1930s...feature variable interest rates, high down payments and short maturities. Before the Great Depression, Americans typically renegotiated their loans every year.
...residential mortgages were available only for a short term (typically 5-10 years) and featured "bullet" payments on principle on term. Unless borrowers could find means to refinance these loans when the came due, they would have to pay off the outstanding loan balance.
...very low LTV ratios of 50% or less...did not place substantial stress on lenders, because when borrowers were short of cash their property could be sold if necessary to redeem their loan.
No idea what the Wikipedia article says because I haven't seen it, but your peer-edited article (which I've actually seen before) agrees with me that there were lots of 5-year balloons. It says residential mortgages were often 5-10 years featuring "bullet" payments = 5-10 year balloons, but the most typical is 5 years for balloons. That doesn't mean 3-year balloons were unheard of, but 5-years was pretty common. This is well-known among people who've studied real estate finance.
Here's what you said above that you're trying to (incorrectly) generalize because it's of limited scope:
but home loans were essentially 1 year ARMs. Each year you had to convince the bank to re-lend you the money and if rates went up, well hope you found a second job!
That's not the majority of the loans by any means. The article I linked below from the FDIC site tells us that one-year balloons (not ARMs) were solely with commercial banks prior to 1927 due to regulations that didn't allow them to carry extended-term non-farm loans. As a result, in 1925, according to the article, commercial banks only composed 18% of the mortgage market, whereas savings and loans composed 51%.
These regulations on commercial banks were relaxed in 1927 to allow up to 5 years for commercial banks. Life insurers, which also provided mortgages back then, also often had 5-year balloons, sometimes longer, sometimes shorter too. It was savings and loans that allowed longer terms -- up to 12 years, as I mentioned. The data here backs up what I said above, and the other thing that's important to note is that mortgage availability varied greatly regionally because we didn't really have a national mortgage market yet -- certain types of loans weren't available in certain markets:
http://www.fdic.gov/bank/analytical/cfr/mortgage_future_house_finance/papers/Ghent.PDF
Probably the middle and fourth fifths (maybe 81-90) are primary mortgage borrowers...?
Probably--but not in the areas you analyzed. In the areas you looked at, I'd say it was all in the top 10%. Maybe some 81-90.
I cannot possibly agree with you on this. Do you live in any of these areas? There is a common misconception since the boom in early 2000s that only doctors and lawyers are buying houses in California. That is complete and utter bullshit. Look around. Drive through a neighborhood commanding $400-800k. There are plenty of middle class families sitting in those homes in debt to their eyeballs. Drive through a neighborhood in CA commanding $200-300k...with your windows up. Lots of those people are homeowners, too.
Don't go changing things now. Some costs have gone away (long distance calling bills), some have increased. Let's try to stick to facts.
Fine. Health care. anyway, 10% is at least margin of error in any of the calculations we make to attempt to justify the cost of housing.
The NY Times rent vs buy calculator is of great value as far as getting a good estimate on the comparison between buying and renting.
The Submedian calculator is much better and includes things like insurance, maintenance, property tax, and opportunity cost:
http://submedian.blogspot.com/
When interest rates go down, prices go up.
I know your statement seems intuitive, but historically there is basically no correlation between interest rates and housing price movement.
What JH is saying is true to some extent, but it happens very slowly because the housing market is so illiquid, and it could be masked by other macroeconomic factors. The concept that most people shop largely on monthly payment for housing is not controversial. The "no correlation" claim is usually based on nominal prices, but there may be a correlation when you use inflation adjusted numbers. Check out this post from Calculated Risk:
http://www.calculatedriskblog.com/2013/06/house-prices-and-mortgage-rates.html
What the inflation-adjusted chart describes is that housing prices stayed largely flat through the high-inflation 70s and early 80s years, and even dropped a bit.
What this really means is that when rates go up, sometimes people have to stretch to buy the houses they want at the same price, whereas before it was a more comfortable payment. Over time, this results in pressure that makes prices rise less slowly relative to inflation, and they could even drop if it's dramatic enough (see the 70s and early 80s).
The conclusion from Calculated Risk is not that that there is no correlation between rates and prices, but rather that other economic factors could affect prices more heavily than rates during certain periods. The theory for the extended 90s flat spot is the general recessionary influence plus some localized housing bubbles, as opposed to mortgage rates. The most recent massive bubble is coupled with a lowering of rates, and the bust has even lower rates in some cases, but obviously macro factors had a big effect on both.
The "no correlation" claim is usually based on nominal prices, but there may be a correlation when you use inflation adjusted numbers.
There probably is a slight correlatoin when using inflation adjusted numbers, but why would you do that?? You don't buy with inflation adjusted dollars. Inflation is your best friend as a mortgage holder so adjusting it out is not applicable.
The US mortgage before the 1930s...feature variable interest rates, high down payments and short maturities. Before the Great Depression, Americans typically renegotiated their loans every year.
A variable interest rate 5 year loan renegotiated by the consumer annually is basically a 1/1 ARM. Overgeneralization? Ok, whatever.
I originally stated that borrowers had to renegotiated annually. It was by choice. That would only be required if interest rates increased.
The most recent massive bubble is coupled with a lowering of rates, and the bust has even lower rates in some cases, but obviously macro factors had a big effect on both.
This would be why subprime (ARMs, zero down loans, interest only loans, 40 year loans and to poor borrowers) came into vogue in the massive bubble. It was banks trying to make the monthly payment scenario work. When prices got out of line and when higher monthly payments came due to subprime borrowers....the bottom dropped out. The macro spread of the risk didn't help, but I still think one can make an argument for the monthly payment issue here, also.
You don't buy with inflation adjusted dollars. Inflation is your best friend as a mortgage holder so adjusting it out is not applicable.
Sure, but it'd be silly to say that interest rates aren't affected by inflation. Certainly in the 70s and 80s, the correlation is more obvious.
Inflation is your best friend if you already have a mortgage, but that's irrelevant to a discussion of housing prices. Inflation is not necessarily your best friend if you are trying to get a mortgage.
It was banks trying to make the monthly payment scenario work. When prices got out of line and when higher monthly payments came due to subprime borrowers....the bottom dropped out.
Yes, I'd agree with that. It was about monthly payment there, which is why you had bizarre non-prime loans and interest-only crap, and all the teaser rates.
I don't like using the word "subprime" casually, as the media does. Subprime has a technical meaning within the mortgage market. You can read the Calculated Risk posts about this by the late Tanta, but the summary is that:
prime = good Capacity to pay, good Collateral, and good Credit (3 Cs)
subprime = good Capacity to pay, good Collateral, and slightly less good Credit (still have 3 Cs)
Some of the loan products sold during the boom didn't appropriately evaluate Capacity and Collateral, and overweighted Credit. A good example is "Alt-A" loans, which were called that because they were presumed to be an Alternative to A-Paper (i.e. prime) based largely on evaluation of Credit only, but it turned out the financial modeling was wrong, and they weren't an alternative.
Similarly low-doc/no-doc meant you didn't appropriately evaluate Capacity. Sometimes banks also gave loans on properties that were bad Collateral too.
Sure, but it'd be silly to say that interest rates aren't affected by inflation.
Certainly. Inflation is the largest driver.
Inflation is your best friend if you already have a mortgage, but that's irrelevant to a discussion of housing prices. Inflation is not necessarily your best friend if you are trying to get a mortgage.
Right--that's why I'd say you have to use nominal prices. Otherwise you mask the effect of inflation.
Right--that's why I'd say you have to use nominal prices. Otherwise you mask the effect of inflation.
Right, but we're talking about trying to isolate effects here. There is definitely a partial correlation between rates and pricing, but you have to tease out the effects. I think we're talking about the same thing and not really disagreeing on this except in wording -- there are definitely other factors that affect this and in some cases may affect it more, as I suggested for the 90s and for the most recent boom/bust cycle.
Right, but we're talking about trying to isolate effects here. There is definitely a partial correlation between rates and pricing, but you have to tease out the effects. I think we're talking about the same thing and not really disagreeing on this except in wording -- there are definitely other factors that affect this and in some cases may affect it more, as I suggested for the 90s and for the most recent boom/bust cycle.
I think so too. My only comment is that there's no point separating out the effect of interest rate when it's always drowned out.
I think so too. My only comment is that there's no point separating out the effect of interest rate when it's always drowned out.
I don't think you can say interest rate effects are drowned out by inflation. If that was the case, home prices would only rise with inflation. My argument is that they are beyond that in CA and other expensive areas because interest rates are also extremely low right now.
I don't expect a big rise or a big slump; just a gradual, subtle downhill adjustment. The top was 2013, and it was based in a rally, government bailouts and low interest rates. The rally is getting a little surreal compared to the truth, even for the types who actually believe the media is free.
To Season or Not to Season, That is the Question:
If you don't believe that housing is seasonal, then I don't think you have any business commenting on a housing blog.
Sure it's seasonal.... All that snow in CA, AZ, NM, NV, TX, FL, AL and others has really put a damper on sales....
Do you disagree that sales in the all the above states are higher in the summer and lower in the winter EVERY YEAR?
The seasonality is not solely from snow/bad weather. I'll give you a clue--what takes a break for the summer?
tatupu70 says
OK--it's a nice analysis, but very specific to one certain area.
Thanks, I've also tried it in the LA area and San Jose (ie, BA outside of Steve Jobs' direct sphere of influence). I was mainly looking at the difference between me buying today vs. my parents buying 30 years ago. Trying to figure out how to complain to them that life isn't fair.
Unfortunately, I was wrong.
You haven't factored in the much higher cost of college nor that an expensive time consuming degree is now a requirement to get a job which only required a high school diploma in your parents day. Nor have you accounted for the windfall your parents received in higher prices for their homes along with the ability to refi at constantly dropping interest rates.
Or how about some expectation of job security, the ability of a middle class family to afford a home payment on ONE income and not live paycheck to paycheck. Ask your parents about pensions too.
I think we would need to look at historical quintiles to confirm this. Because...
OK here you go:
Your chart is after tax, DTI ratios are calculated on gross income. Therefore, the monthly payment does not change based on DTI ratio whether we have pre-Reagan tax rates or post-Bush tax rates. We just have a little more expendable income than in 1979.
These are the complaints that drove me to figure out if they were also getting away with forcing higher housing prices on us. Unfortunately, based on a monthly payment houses are roughly the same cost. At least they aren't hosing us on that.
You haven't factored in the much higher cost of college nor that an expensive time consuming degree is now a requirement to get a job which only required a high school diploma in your parents day.
That is going to kill housing soon.
Nor have you accounted for the windfall your parents received in higher prices for their homes along with the ability to refi at constantly dropping interest rates.
And that is where they ARE hosing us. On top of this, we need higher down payments because prices have risen more than just with inflation.
Or how about some expectation of job security, the ability of a middle class family to afford a home payment on ONE income and not live paycheck to paycheck. Ask your parents about pensions too.
My wife would prefer to choose to stay home and raise the kids. That's what women's lib did for her...gave her a choice. Unfortunately, housing is the main reason she cannot.
We are trying really hard to do "better" than our parents so that our kids grow up with more than we did. Somehow with a combined six figure income (even after retirement and health care are covered) this is still not possible! ...because of all those intangibles you listed...
So I'm still with you--they still got a better deal...
Your chart is after tax, DTI ratios are calculated on gross income. Therefore, the monthly payment does not change based on DTI ratio whether we have pre-Reagan tax rates or post-Bush tax rates. We just have a little more expendable income than in 1979.
It is based on after tax--the point was increasing disparity can lead one to make false conclusions based on medians.
Not sure why you are bringing up DTI ratios? Are you implying that incomes haven't increased in the last 30 years--that it's only tax savings?
It is based on after tax--the point was increasing disparity can lead one to make false conclusions based on medians.
Not sure why you are bringing up DTI ratios? Are you implying that incomes haven't increased in the last 30 years--that it's only tax savings?
These numbers, since they are after tax and therefore have no bearing on DTI ratios, do not change the monthly affordability argument. I do understand your statement that there is income growth disparity, but I do not accept your assumption that the top quintile are the main drivers of home purchasing. The home ownership rate is over 60% and has been long before 1980s. Therefore, at least three quintiles are purchasing homes. Outside of the fortress, I don't believe there are enough in the top 1% to drive prices through the roof for everyone else seeking financing. Therefore, I am hard pressed to accept your idea that wealth disparity is a significant driver in the increase in home values.
Rather, the driver of high home values is the willingness of banks and consumers to lend and borrow, respectively, at historically high rates. In 1949, mortgage debt was 20% of household income; in 1979, 46%; now it is over 100%. As a nation, we are not earning more, we are borrowing more. In 2012, the average Californian had $304k mortgage debt, $10k student loan, $14k car, and $7k credit card. (www.debt.org) These are simply averages, but they paint an ugly picture.
These numbers, since they are after tax and therefore have no bearing on DTI ratios, do not change the monthly affordability argument. I do understand your statement that there is income growth disparity, but I do not accept your assumption that the top quintile are the main drivers of home purchasing. The home ownership rate is over 60% and has been long before 1980s. Therefore, at least three quintiles are purchasing homes. Outside of the fortress, I don't believe there are enough in the top 1% to drive prices through the roof for everyone else seeking financing. Therefore, I am hard pressed to accept your idea that wealth disparity is a significant driver in the increase in home values.
Outside of the BA, house prices haven't been driven through the roof as far as I can tell.
Rather, the driver of high home values is the willingness of banks and consumers to lend and borrow, respectively, at historically high rates. In 1949, mortgage debt was 20% of household income; in 1979, 46%; now it is over 100%. As a nation, we are not earning more, we are borrowing more.
No--as a nation, we ARE earning more. But because of wealth disparity, the median hasn't gained much. And therefore, average Joe does have to borrow more.
Outside of the BA, house prices haven't been driven through the roof as far as I can tell.
In the very expensive parts of the BA, housing is based on cash and large down payments. However, in most of the BA as well as Southern California, NYC, and other expensive areas, it is the same cost based on monthly payment as it has been over the past 30 years. And the middle class purchasing in most of those neighborhoods is NOT earning more. Only the top 10% are earning LOTS more, and that is mostly at the top 1%. They are NOT the ones buying most of the homes in the BA or LA or NYC. The middle class is and they are borrowing up to their eyeballs to do it.
I do not accept your assumption that the top quintile are the main drivers of home purchasing. The home ownership rate is over 60% and has been long before 1980s.
Previous ownership is not relevant for recent buying just like inventory available for sale is not the same as the entire housing stocks. In BA, inventory for a year is about 1-3% of total housing stocks. In other words, need only less than 1% of the population to push prices up.
No--as a nation, we ARE earning more. But because of wealth disparity, the median hasn't gained much. And therefore, average Joe does have to borrow more.
That is true as the top 10% wealth gain since 2009 has been due to the stock market run up which 1/2 of it is because of the Federal Reserve policies (i.e., low interest rates to borrow money, etc.) and the other 1/2 of it because of corporations squeezing out more profits (i.e., due to outsourcing to foreign countries, etc.).
I do not accept your assumption that the top quintile are the main drivers of home purchasing. The home ownership rate is over 60% and has been long before 1980s.
Previous ownership is not relevant for recent buying just like inventory available for sale is not the same as the entire housing stocks. In BA, inventory for a year is about 1-3% of total housing stocks. In other words, need only less than 1% of the population to push prices up.
I will only buy this theory if you can prove to me that the median buyer in the city of San Jose is in the top 1% of earners.
I thought this post was about SoCal.
In many areas it is better to rent. But there are pockets where it is better to buy. It depends on many factors. Real estate is again LOCAL.
I will only buy this theory if you can prove to me that the median buyer in the city of San Jose is in the top 1% of earners.
Not sure how relevant is the median buyer. What i meant is if the inventory of a city is, for example, 30 per month only need 3 buyers to 'overpay'/pay high (whatever words you like) to push the price up. If the housing stocks is 20,000. It represents 0.015% of the housing stocks. I don't know why income of the city matters as the buyers can be from anywhere, some from overseas too. Is even more true for desirable neighborhood.
« First « Previous Comments 119 - 158 of 177 Next » Last » Search these comments
http://www.latimes.com/business/money/la-fi-mo-rent-or-buy-20140220,0,6388101.story#axzz2ttk8yllG
#housing