patrick.net
An Antidote to Corporate Media
1,235,402 comments by 14,772 users - ElYorsh, Onvacation, RC2006 online now
Bad News For America's Biggest Housing Bubble: San Francisco Home Prices Suffer
2015 Mar 31, 11:12am 29,607 views 58 comments
Comments 1 - 40 of 58 Next » Last » Search these comments
Until today, because in today's Case-Shiller update for the month of January housing prices across the US, it was none other than San Francisco which posted the largest sequential drop in home prices.
Oh, noes. The prices are only RISING at 2% these days. Whatever will home owners do??
Month..........Price......................General Patnet Narrative
Mar-2009 .....117.71 (bottom)..Don't buy now, prices are gonna CRASH!
Apr-2009......118.46.....Don't buy now, prices are gonna CRASH!
May-2009.....120.16.....Don't buy now, prices are gonna CRASH!
Jun-2009......124.7......Don't buy now, prices are gonna CRASH!
Jul-2009.......128.86.....Don't buy now, prices are gonna CRASH!
Aug-2009 .....132.47.....Don't buy now, prices are gonna CRASH!
Sep-2009 .....134.16.....Don't buy now, prices are gonna CRASH!
Oct-2009......135.81.....Don't buy now, prices are gonna CRASH!
Nov-2009 .....136.63.....Don't buy now, prices are gonna CRASH!
Dec-2009 .....136.4......Don't buy now, prices are gonna CRASH!
Jan-2010......135.63.....Don't buy now, prices are gonna CRASH!
Feb-2010 .....134.67.....Don't buy now, prices are gonna CRASH!
Mar-2010 .....136.74.....Don't buy now, prices are gonna CRASH!
Apr-2010......139.77.....Don't buy now, prices are gonna CRASH!
May-2010.....142.16.....Don't buy now, prices are gonna CRASH!
Jun-2010......142.55.....Don't buy now, prices are gonna CRASH!
Jul-2010.......143.23.....Don't buy now, prices are gonna CRASH!
Aug-2010 .....142.83.....Don't buy now, prices are gonna CRASH!
Sep-2010 .....141.54.....Don't buy now, prices are gonna CRASH!
Oct-2010......138.84.....Don't buy now, prices are gonna CRASH!
Nov-2010 .....137.28.....Don't buy now, prices are gonna CRASH!
Dec-2010 .....136.02.....Don't buy now, prices are gonna CRASH!
Jan-2011......133.37.....Don't buy now, prices are gonna CRASH!
Feb-2011......129.96.....Don't buy now, prices are gonna CRASH!
Mar-2011......129.83.....Don't buy now, prices are gonna CRASH!
Apr-2011.......132.02.....Don't buy now, prices are gonna CRASH!
May-2011......134.42.....Don't buy now, prices are gonna CRASH!
Jun-2011.......134.9......Don't buy now, prices are gonna CRASH!
Jul-2011........135.28.....Don't buy now, prices are gonna CRASH!
Aug-2011 ......135.2......Don't buy now, prices are gonna CRASH!
Sep-2011 ......133.22.....Don't buy now, prices are gonna CRASH!
Oct-2011.......132.34.....Don't buy now, prices are gonna CRASH!
Nov-2011 ......129.78.....Don't buy now, prices are gonna CRASH!
Dec-2011 ......128.72.....Don't buy now, prices are gonna CRASH!
Jan-2012.......125.47.....Don't buy now, prices are gonna CRASH!
Feb-2012 ......124.64.....Don't buy now, prices are gonna CRASH!
Mar-2012 ......125.94.....Don't buy now, prices are gonna CRASH!
Apr-2012.......130.23.....Don't buy now, prices are gonna CRASH!
May-2012......135.28.....Don't buy now, prices are gonna CRASH!
Jun-2012.......139.01.....Don't buy now, prices are gonna CRASH!
Jul-2012........141.71.....Don't buy now, prices are gonna CRASH!
Aug-2012 ......142.37.....Don't buy now, prices are gonna CRASH!
Sep-2012 ......143.15.....Don't buy now, prices are gonna CRASH!
Oct-2012.......144.15.....Don't buy now, prices are gonna CRASH!
Nov-2012 ......146.23.....Don't buy now, prices are gonna CRASH!
Dec-2012 ......147.24......Don't buy now, prices are gonna CRASH!
Jan-2013.......147.45.....Don't buy now, prices are gonna CRASH!
Feb-2013 ......148.23.....Don't buy now, prices are gonna CRASH!
Mar-2013 ......153.96.....Don't buy now, prices are gonna CRASH!
Apr-2013.......161.46.....Don't buy now, prices are gonna CRASH!
May-2013......168.41.....Don't buy now, prices are gonna CRASH!
Jun-2013.......173.01.....Don't buy now, prices are gonna CRASH!
Jul-2013........176.8......Don't buy now, prices are gonna CRASH!
Aug-2013 ......178.53.....Don't buy now, prices are gonna CRASH!
Sep-2013 ......179.91.....Don't buy now, prices are gonna CRASH!
Oct-2013.......179.55.....Don't buy now, prices are gonna CRASH!
Nov-2013 ......180.19.....Don't buy now, prices are gonna CRASH!
Dec-2013 ......180.55.....Don't buy now, prices are gonna CRASH!
Jan-2014.......181.52.....Don't buy now, prices are gonna CRASH!
Feb-2014.......181.91.....Don't buy now, prices are gonna CRASH!
Mar-2014.......186.69.....Don't buy now, prices are gonna CRASH!
Apr-2014........191.2.....Don't buy now, prices are gonna CRASH!
May-2014.......194.7.....Don't buy now, prices are gonna CRASH!
Jun-2014........195.89.....Don't buy now, prices are gonna CRASH!
Jul-2014.........195.49.....Don't buy now, prices are gonna CRASH!
Aug-2014 .......194.62.....Don't buy now, prices are gonna CRASH!
Sep-2014 .......194.47.....Don't buy now, prices are gonna CRASH!
Oct-2014........196.23.....Don't buy now, prices are gonna CRASH!
Nov-2014 .......196.48.....Don't buy now, prices are gonna CRASH!
Dec-2014 .......197.46.....Don't buy now, prices are gonna CRASH!
Jan-2015........195.77.....SEE - I TOLD YOU SO!!!!!!!!!!!!!!
EJECT!!! EJECT!!! EJECT!!!!!
*

If that graph were global temperature data, you'd be serving up infantile grade-school insults to anyone who quoted it.
As the chart above shows, it was not only the annual growth rate of only 7.9%, matching the lowest since the European debt bubble burst in 2010, but also the sequential rate of price drops, at -0.9% - the biggest monthly drop in three years, or since January 2012 - that will once again be a subject for concern of housing watchers.
Ha ha ha. Prices go up 7.9% and it's a crash?
Can someone remind me what happened since January 2012. It's OK, I just remembered.....Prices exploded.
Call Crazy, do you need to borrow my fire extinguisher that I got from Costco?
Absolutely not a crash. Yes, prices exploded. And they will do everything they can to keep the housing market afloat like they have, even if it means selling out future generations as well as savers. In that respect betting on housing is safer, you have inherent crony support. But there will come a point when the game is up and you don't want to be left holding the bag. People buying now here in the bay area are the future bag-holders who will "need" bail-outs from responsible taxpayers who already pay income tax through the nose. The only people who don't care either way are foreign investors just looking to bring their money to safety, for the rest it's getting "interesting" again.
Absolutely not a crash. Yes, prices exploded. And they will do everything they can to keep the housing market afloat like they have, even if it means selling out future generations as well as savers. In that respect betting on housing is safer, you have inherent crony support. But there will come a point when the game is up and you don't want to be left holding the bag. People buying now here in the bay area are the future bag-holders who will "need" bail-outs from responsible taxpayers who already pay income tax through the nose. The only people who don't care either way are foreign investors just looking to bring their money to safety, for the rest it's getting "interesting" again.
Mell, you have addressed several points in one paragraph that reflects the views of many. I would like to respond to each one of them.
1. Who is "they"? There is no single person or an entity that has the power to control housing prices. If they did the housing crash of 2008 would not have happened.
2. Future generations and savers use housing as one means of saving.
3. There is no bag. If you hold on long enough you will come out ahead as home prices always come back. (In regions where population keeps increasing)
4. There will be no bailout in California coastal regions. Any future price pull backs, and they will come, will only be temporary as history has repeatedly proven.
5. If foreigners trust US real estate more then any other place, why don't you? We had the biggest crash in real estate since the great depression, and yet US real estate is considered the best bet. Never bet against America.
But there will come a point when the game is up and you don't want to be left holding the bag. People buying now here in the bay area are the future bag-holders who will "need" bail-outs from responsible taxpayers who already pay income tax through the nose.
What I thought was interesting from the C/S report today was that overall, they said prices were up 4.6% nationwide Jan 2014 to Jan 2015. On the other end, average 30 year mortgage rates dropped from 4.43% in Jan. 2014 to 3.71% in Jan. 2015, so in reality, the 0.7% drop in rates resulted in the 4.6% rise in prices, since 2/3rds of people buy with a mortgage.
I don't think that 4.6% "growth" was organic, just a echo of the lower interest rate, since every 1% drop in rate increase borrowing power 10% for the same payment amount.
Your comments are thought provoking. Based on that, real estate prices should be a lot lot higher. Availability of loans throws a spanner in the works.
People can only pay what they can afford.. Prices can't go up if wages don't go up. Since wages have been flat, the only way for prices to rise is for rates to drop (like I said above), so the buyers can get a more expensive house for the same payment.
Rates have dropped from 17% in 1981 to 3%. Wages have also increased 3 fold since then. So home prices based on that should be atleast 20 fold 1981 prices.
I think mostly what it means is that California's future prospects are going to shrink and the growth will be elsewhere.
Yea, Utah. That's where the growth is going to be.
Utah, get me two!!
He hasn't a clue what he believes
Ffs, the kid can barely construct a sentence, let alone a thought
He hasn't a clue what he believes
Ffs, the kid can barely construct a sentence, let alone a thought
Projecting again
What are you reading, some picture book? Illustrating trees growing in Utah?
What are you reading, some picture book? Illustrating trees growing in Utah?
Sometime between bowls you might try reading it.
It was an article by Joel Kotkin in the City magazine.
so in reality, the 0.7% drop in rates resulted in the 4.6% rise in prices
If this were the case, how do you explain the 13% price rise from Jan 2013 until 2014 when interest rates rose approx. 1%? This coincides with the "10% drop in buying power" you noted on the chart above. Put another way,
the 0.7% drop in rates resulted in 4.6% rise in prices (2014-2015)
the 1.0% RISE in rates resulted in a 13% rise in prices (2013-2014)
How is this possible?
You may well be right about Utah and Colorado. No reason to expect growth and population increase in California won't continue as it always has.
California will always sit on the Throne. :)
Not according to the article, this is Kotkin's thing
Dear Patnet friends,
We are on the cusp of another major and sustained rise in home prices. If you missed the first boat this is your opportunity not to miss the next boat. It's about to leave.
Thanks
Strategist
You may well be right about Utah and Colorado. No reason to expect growth and population increase in California won't continue as it always has.
California will always sit on the Throne. :)Not according to the article, this is Kotkin's thing
It's possible these states will have a higher growth rate than California. But they come from a very small economic base compared to California the 8th largest economy the world.
I have been hearing doomsday predictions for California since day one, yet the sun continues to shine.
I have been hearing doomsday predictions for California since day one, yet the sun continues to shine.
Yup, the bottom line is jobs. The bottom line on that is cites are a more efficient way to live and the exchange of ideas promulgate in areas that foster innovation. So the question is can that occur elsewhere? I think Austin is indicative that it can? Not to mention how technology has made communication easier.
You can be in the middle of the Pacific and get your work done with a computer and internet.
Austin is now a major technological center with low home prices and good jobs. If I was working in tech and couldn't afford SV homes, I would just move to Austin.
Rates have dropped from 17% in 1981 to 3%. Wages have also increased 3 fold since then. So home prices based on that should be atleast 20 fold 1981 prices.
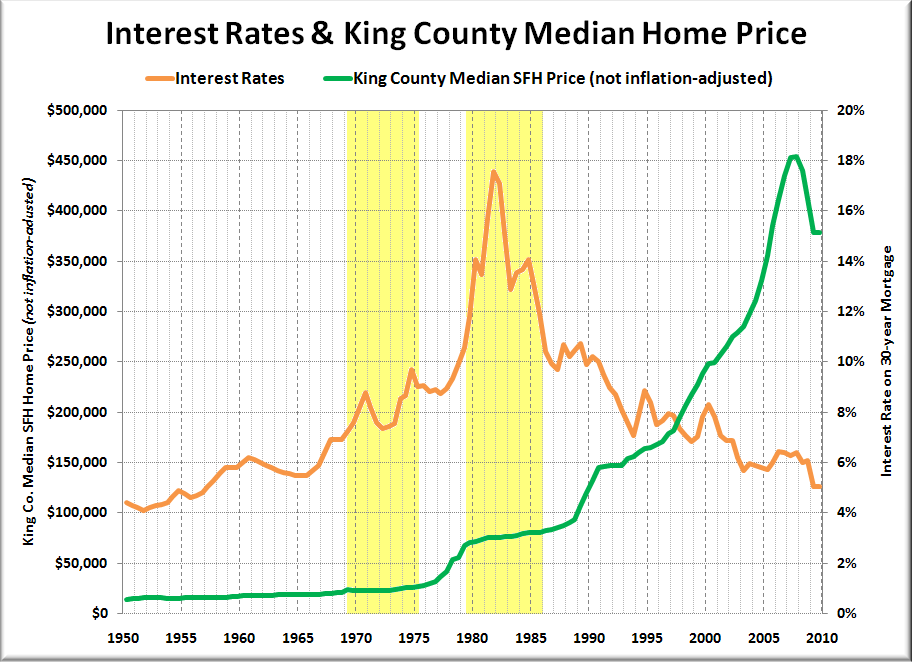
See any general trend line in these two graphs?
Rates are down and home prices are up. We still need to factor in wages and come up with an affordability index to really get the right picture. You can come up with a whole set of affordability indexes. As long as you plot the same index over time you will be fine. I would just stick with the one economists use the most.
If you use the "real income" data for wages, you will need to use the "real" home prices too.
Just cut to the chase and use the regular affordability index.
If you use the "real income" data for wages, you will need to use the "real" home prices too.
Just cut to the chase and use the regular affordability index.Feel free to step up and provide them.... After all your the finance and economist guy here!
I have many times. But OK, when I get back.
Chinese cash buyers
Everywhere? Remember, the 13% rise I quoted is the national number - the same index you used when you said: "the 0.7% drop in rates resulted in 4.6% rise in prices". Clearly, Chinese cash buyer are not pushing up the national number. So again, nationally we can say that:
the 0.7% drop in rates resulted in 4.6% rise in prices (2014-2015)
the 1.0% RISE in rates resulted in a 13% rise in prices (2013-2014)
How is this possible?
You tell me, since you're trying to bait the question.
OK. After researching the issue, I have come to the conclusion that a rise in interest rates does not necessarily mean that we shall see a nominal drop in prices. Intuitively, this is a strange notion I admit - but it works when you understand that nominal wages continue to rise (even if real do not). More importantly, it reconciles the data from the early 1980s where we saw a massive rise in interest rates, with absolutely no drop in nominal prices whatsoever.
In your chart, what happened to prices in the late 80's and following decades when rates headed down?
Lets put this into the "asked and answered" column. No question about it, when the rates fell, prices rose. The question though is, did the first thing lead to the other - and that is what I want to now redirect the focus back toward (i.e. the claim that a rise in rates causes a nominal drop in prices).
In that regard, while I do not appreciate the claim of "cherry picking", I can attest to the fact that nationwide prices did the same thing that Seattle prices - which is to say they eked out very small nominal gains despite the massive spike in interest rates. The national data is below, but if you are not inclined to click on the link, here are end of year values:
Dec 1980.....46.41
Dec 1981.....48.79 (5% increase)
Dec 1982.....49.08 (0.6% increase)
Dec 1983.....51.39 (4.7% increase - 10.7% increase 1980-1983)
http://us.spindices.com/indices/real-estate/sp-case-shiller-us-national-home-price-index
In any event, the data clearly throws a wrench in the "a rise in rates causes a (nominal) drop in prices" claim. After all we now have
a 0.7% drop in rates during a 4.6% rise in prices (2014-2015)
a 1.0% RISE in rates during a 13% rise in prices (2013-2014)
an approx. 8% rise in rates during a 10% rise in prices (1980-1983).
Clearly, if we are to display any intellectual honesty here, this discrepancy must be explained.
Do you have a Word doc open with phrases that you just copy and paste?
Bigs - you too please. No insults for the time being.
I want to see if CIC can come to the inescapable conclusion I want to see if the word combination "yes the data does not show that rising rates = falling nominal prices" can tick off his keyboard. Any other thread you guys can troll all you want, but I want to see what happens here.
CIC again - sorry for the distractions. The data shows us
a 0.7% drop in rates during a 4.6% rise in prices (2014-2015)
a 1.0% RISE in rates during a 13% rise in prices (2013-2014)
an approx. 8% rise in rates during a 10% rise in prices (1980-1983).
Given this discrepancy, how can you continue to maintain that a rise in rates will = a nominal drop in prices?
The best explaination to your 2013-2014 price rises is that during the time frame, even including 2012, there was a large cash and institutional purchase wave going on, not worried about prices but chasing yields. Somewhere in the range of 40% - 50% of buyers. That's not a normal organic housing market. Plus, it was a wave coming off of the bottom of the housing crash, so once again, that's not a "normal" market.
Thanks for a cogent answer. That said, between your answer here and response to the 80s we now have at least two separate and distinct instances where rising rates DOES NOT mean a nominal drop in prices. Yes, we have plenty of instances with falling rates and rising prices, but again there is thusfar no compelling data to indicate rising rates = falling nominal prices. Do you agree with this?
OK. After researching the issue, I have come to the conclusion that a rise in interest rates does not necessarily mean that we shall see a nominal drop in prices. Intuitively, this is a strange notion I admit - but it works when you understand that nominal wages continue to rise (even if real do not). More importantly, it reconciles the data from the early 1980s where we saw a massive rise in interest rates, with absolutely no drop in nominal prices whatsoever.
This is something you don't see every day.
What? someone changing their mind.
So in a 35 year time period, you have a few exceptions to a general trend. Like that is such an abnormal occurrence?
According to your reasoning in any climate-change thread, any deviation from a trend disproves that trend.
See any general trend line in these three graphs?
*

I see a rate reduction continuing that is correlated with outsourcing and bubble creation.
Is it true or not true that for every change of 1% in rate, the buying power changes 10% for the same payment amount?
Is it true or not true that the majority (I didn't say ALL) of people buy houses based on monthly payment amount? Is it true or not true in a normal organic housing market that 2/3 of buyers, buy with a mortgage?
These are both very common sense arguments that I fully understand, but as we have seen the data does not bear out.
I post this again for the rate vs price trend 1950-2009. I can attest that national prices follow the same path, and both data sets show rising prices on a YOY basis (1950-2006), but if you believe I am cherry picking I will post them in a separate link. What I can tell you is this - from 1950 until 1983 there is not a single year period in which national nominal prices declined. None. Thus the only way I can reconcile the common sense view with the data is to note that due to the "stickiness" of prices, and the general trend of wage growth (real or nominal) being a lagging yet necessary component of inflation is to conclude that rising rates do not have much influence on nominal prices. As such, you would assume that those who shop for payments (which I agree with you are a lot of folks) are squeezed out such that the volume of transactions declines at least for short periods of times until wages "catch up" in the nominal or real sense. Note, the data that bears this part out (volume) is spotty at best, but it does help explain a 33 year period that is otherwise unexplainable. In any event, the people who are frozen out at 500K are eventually able to buy a few years later at 515K which given the nominal wage growth, is now suddenly more "affordable"
see a rate reduction continuing that is correlated with outsourcing and bubble creation.
I see rate reductions correlated with wealth inequality.
BTW - to further bolster my point, look what happens when you look at that same graph in not nominal but real (inflation adjusted) terms:
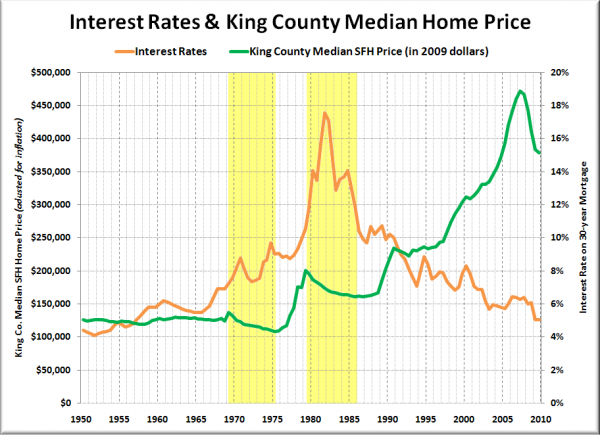
Here we see that the imbalances are resolved not in out and out nominal price declines, but the lagging yet necessary wage growth making things more affordable. Thus the data says that the house that is 500K now should be more affordable in 5 years when it is only 515K.
The problem of course is very few people are happy to pass on a 500k house, rent 5 more years and then buy it at "only" 515K when it is more affordable - yet that is exactly what the real and nominal data both say will happen.
In any event, I offer all this up as a competing narrative to the "rate growth = nominal price declines" which is a common sense narrative but flies in the face of the most comprehensive data I can find on the subject matter. I note this because for years people would cite the rising rates = falling prices meme, and you could tell that they literally thought that if they wait, the 500K house will be 480K, 460K etc. in the future. That is not what the data says. The data says that as rates rise, the 500K house will perhaps underperform, but still rise nonetheless.
Put another way, if someone thinks that due to rising rates, a 500K house will be more "affordable" if they wait a few years when it is only 515K the data says they will be right. However, if they think that due to rising rates the 500K house will become more affordable due to out and out nominal price declines, just know that the data suggests they will be bitterly bitterly disappointed.
If you use the "real income" data for wages, you will need to use the "real" home prices too.
Just cut to the chase and use the regular affordability index.Feel free to step up and provide them.... After all your the finance and economist guy here!
I have many times. But OK, when I get back.
Homes are VERY VERY affordable right now.
The affordability index used by economists. Graph goes back to 1981.
http://research.stlouisfed.org/fred2/graph/?id=COMPHAI,FIXHAI,
Comments 1 - 40 of 58 Next » Last » Search these comments
http://www.zerohedge.com/news/2015-03-31/bad-news-americas-biggest-housing-bubble-san-francisco-home-prices-suffer-biggest-dr
#housing